Stop building dashboards nobody uses
Describe the dashboard you want — get a live, interactive prototype in 60 seconds, and align your team before you build.
Built on frontier models · loved by data teams
Describe it. Don't build it.
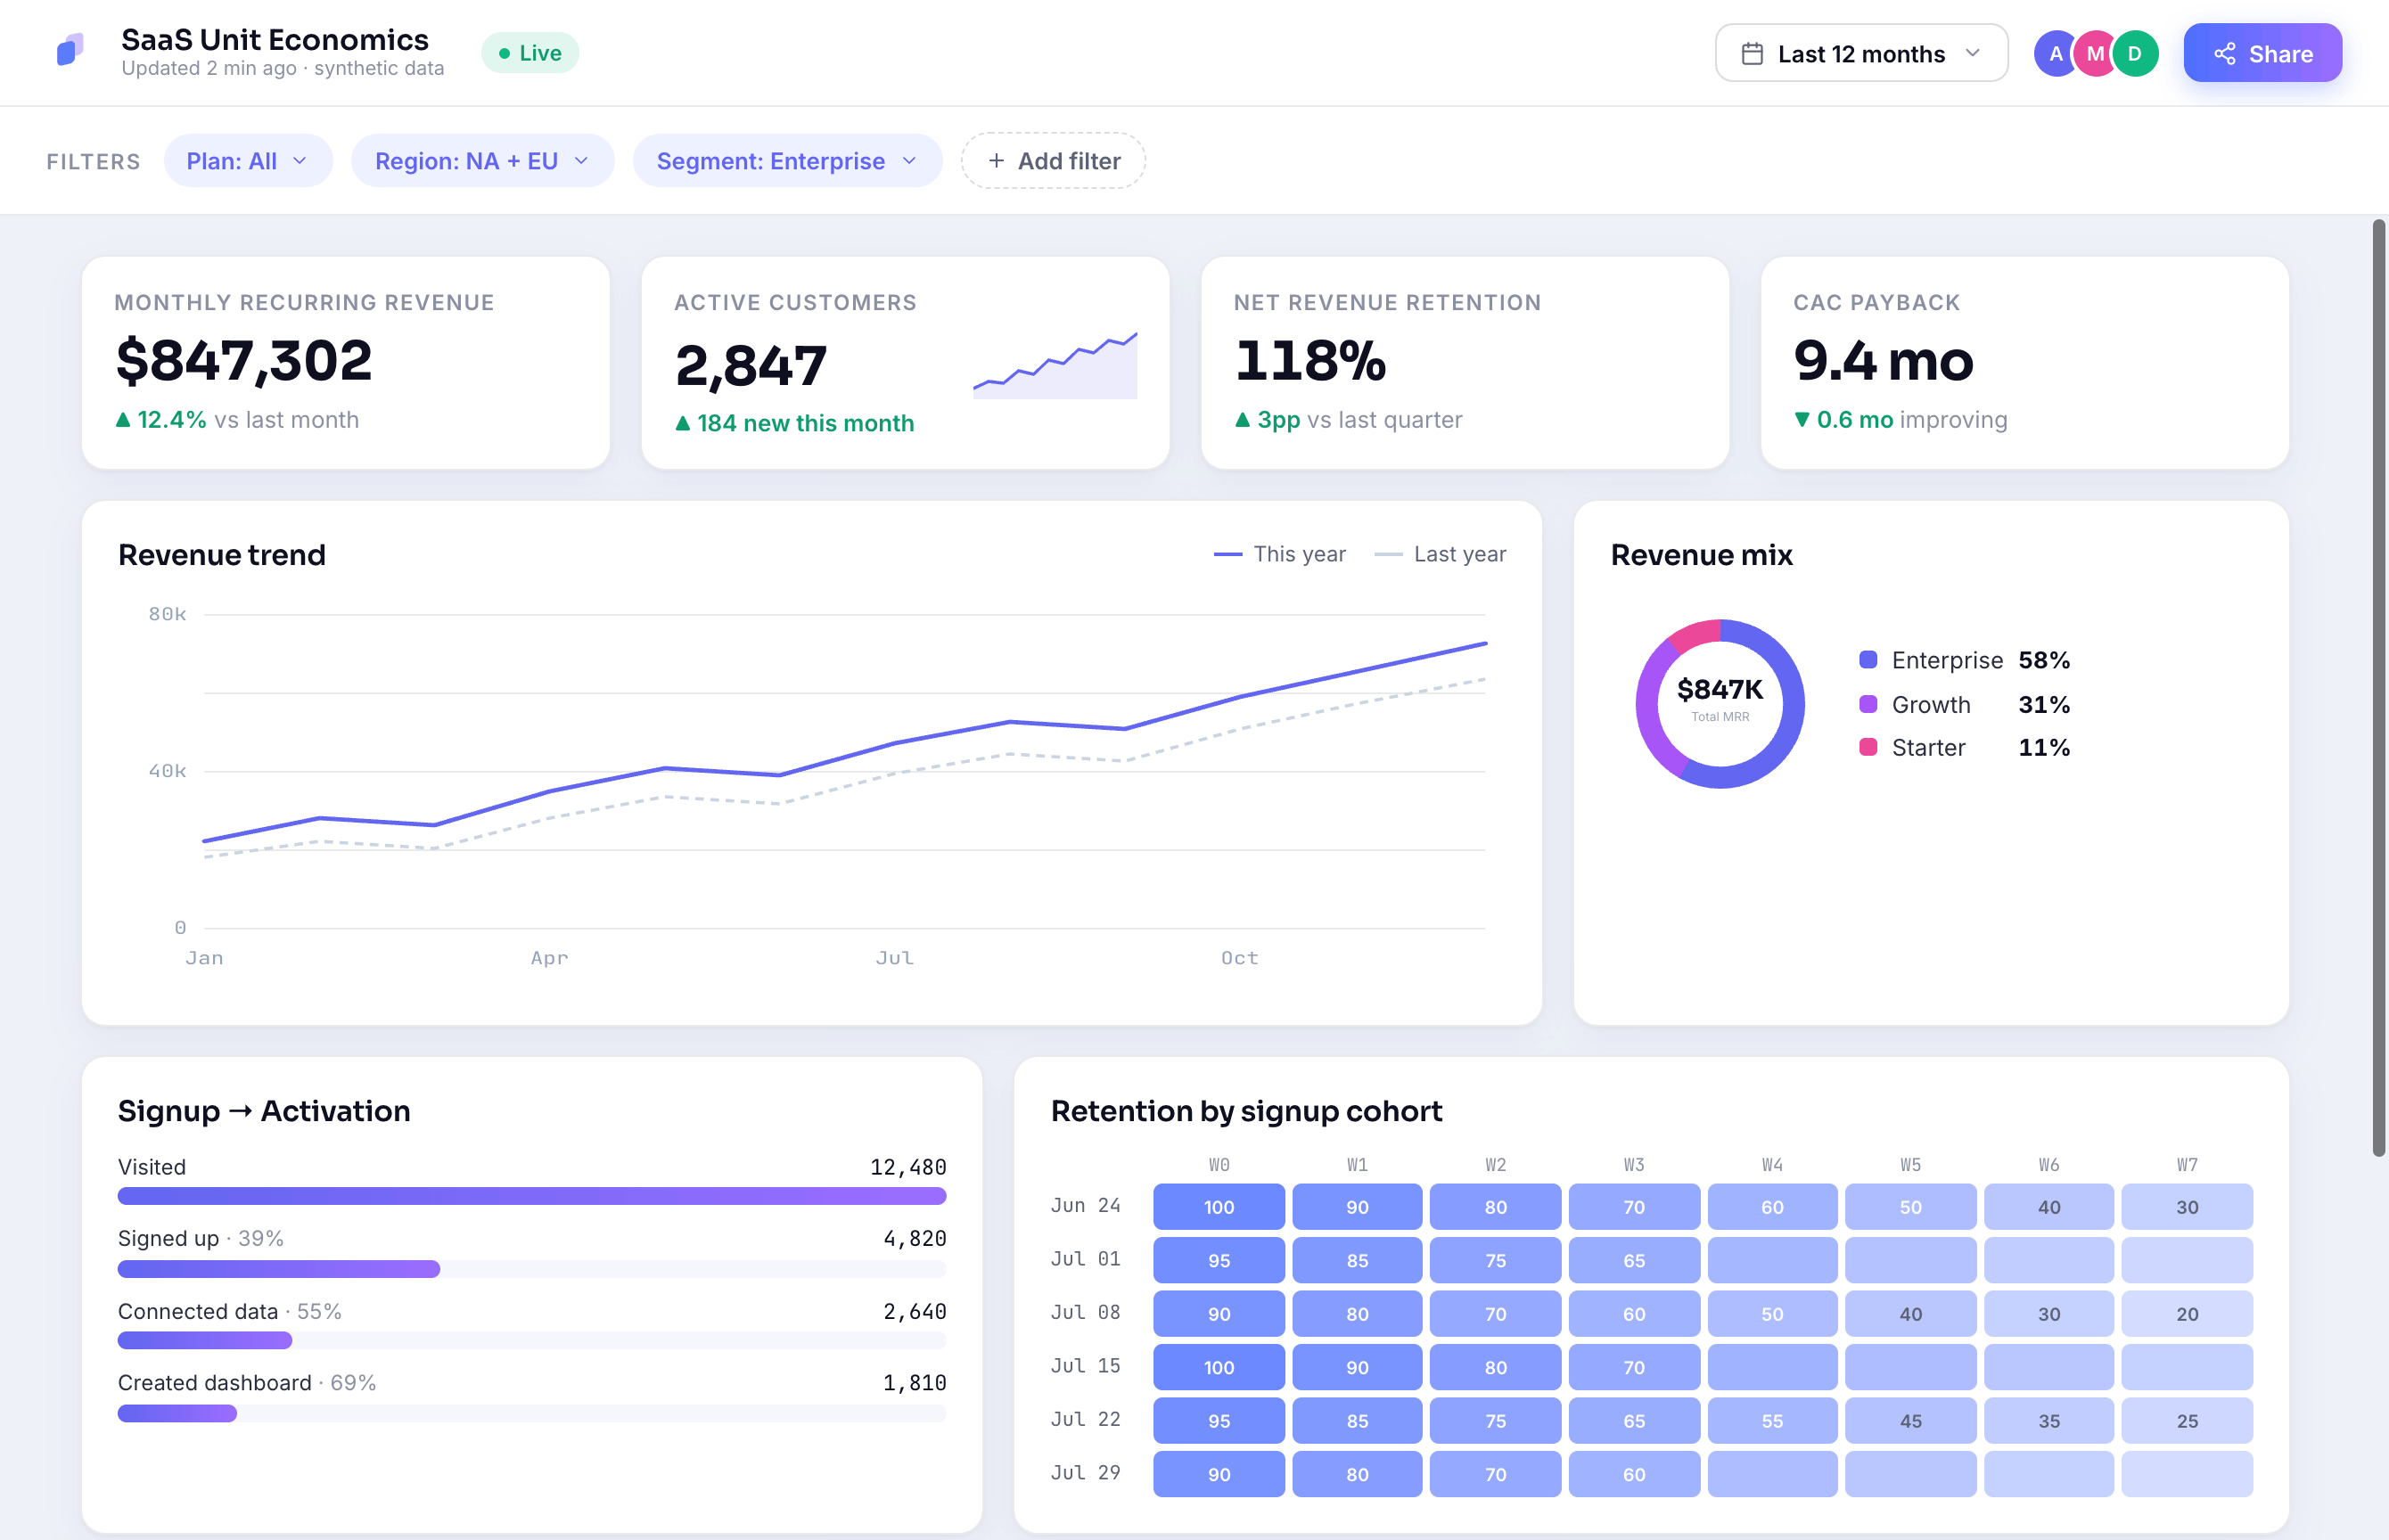
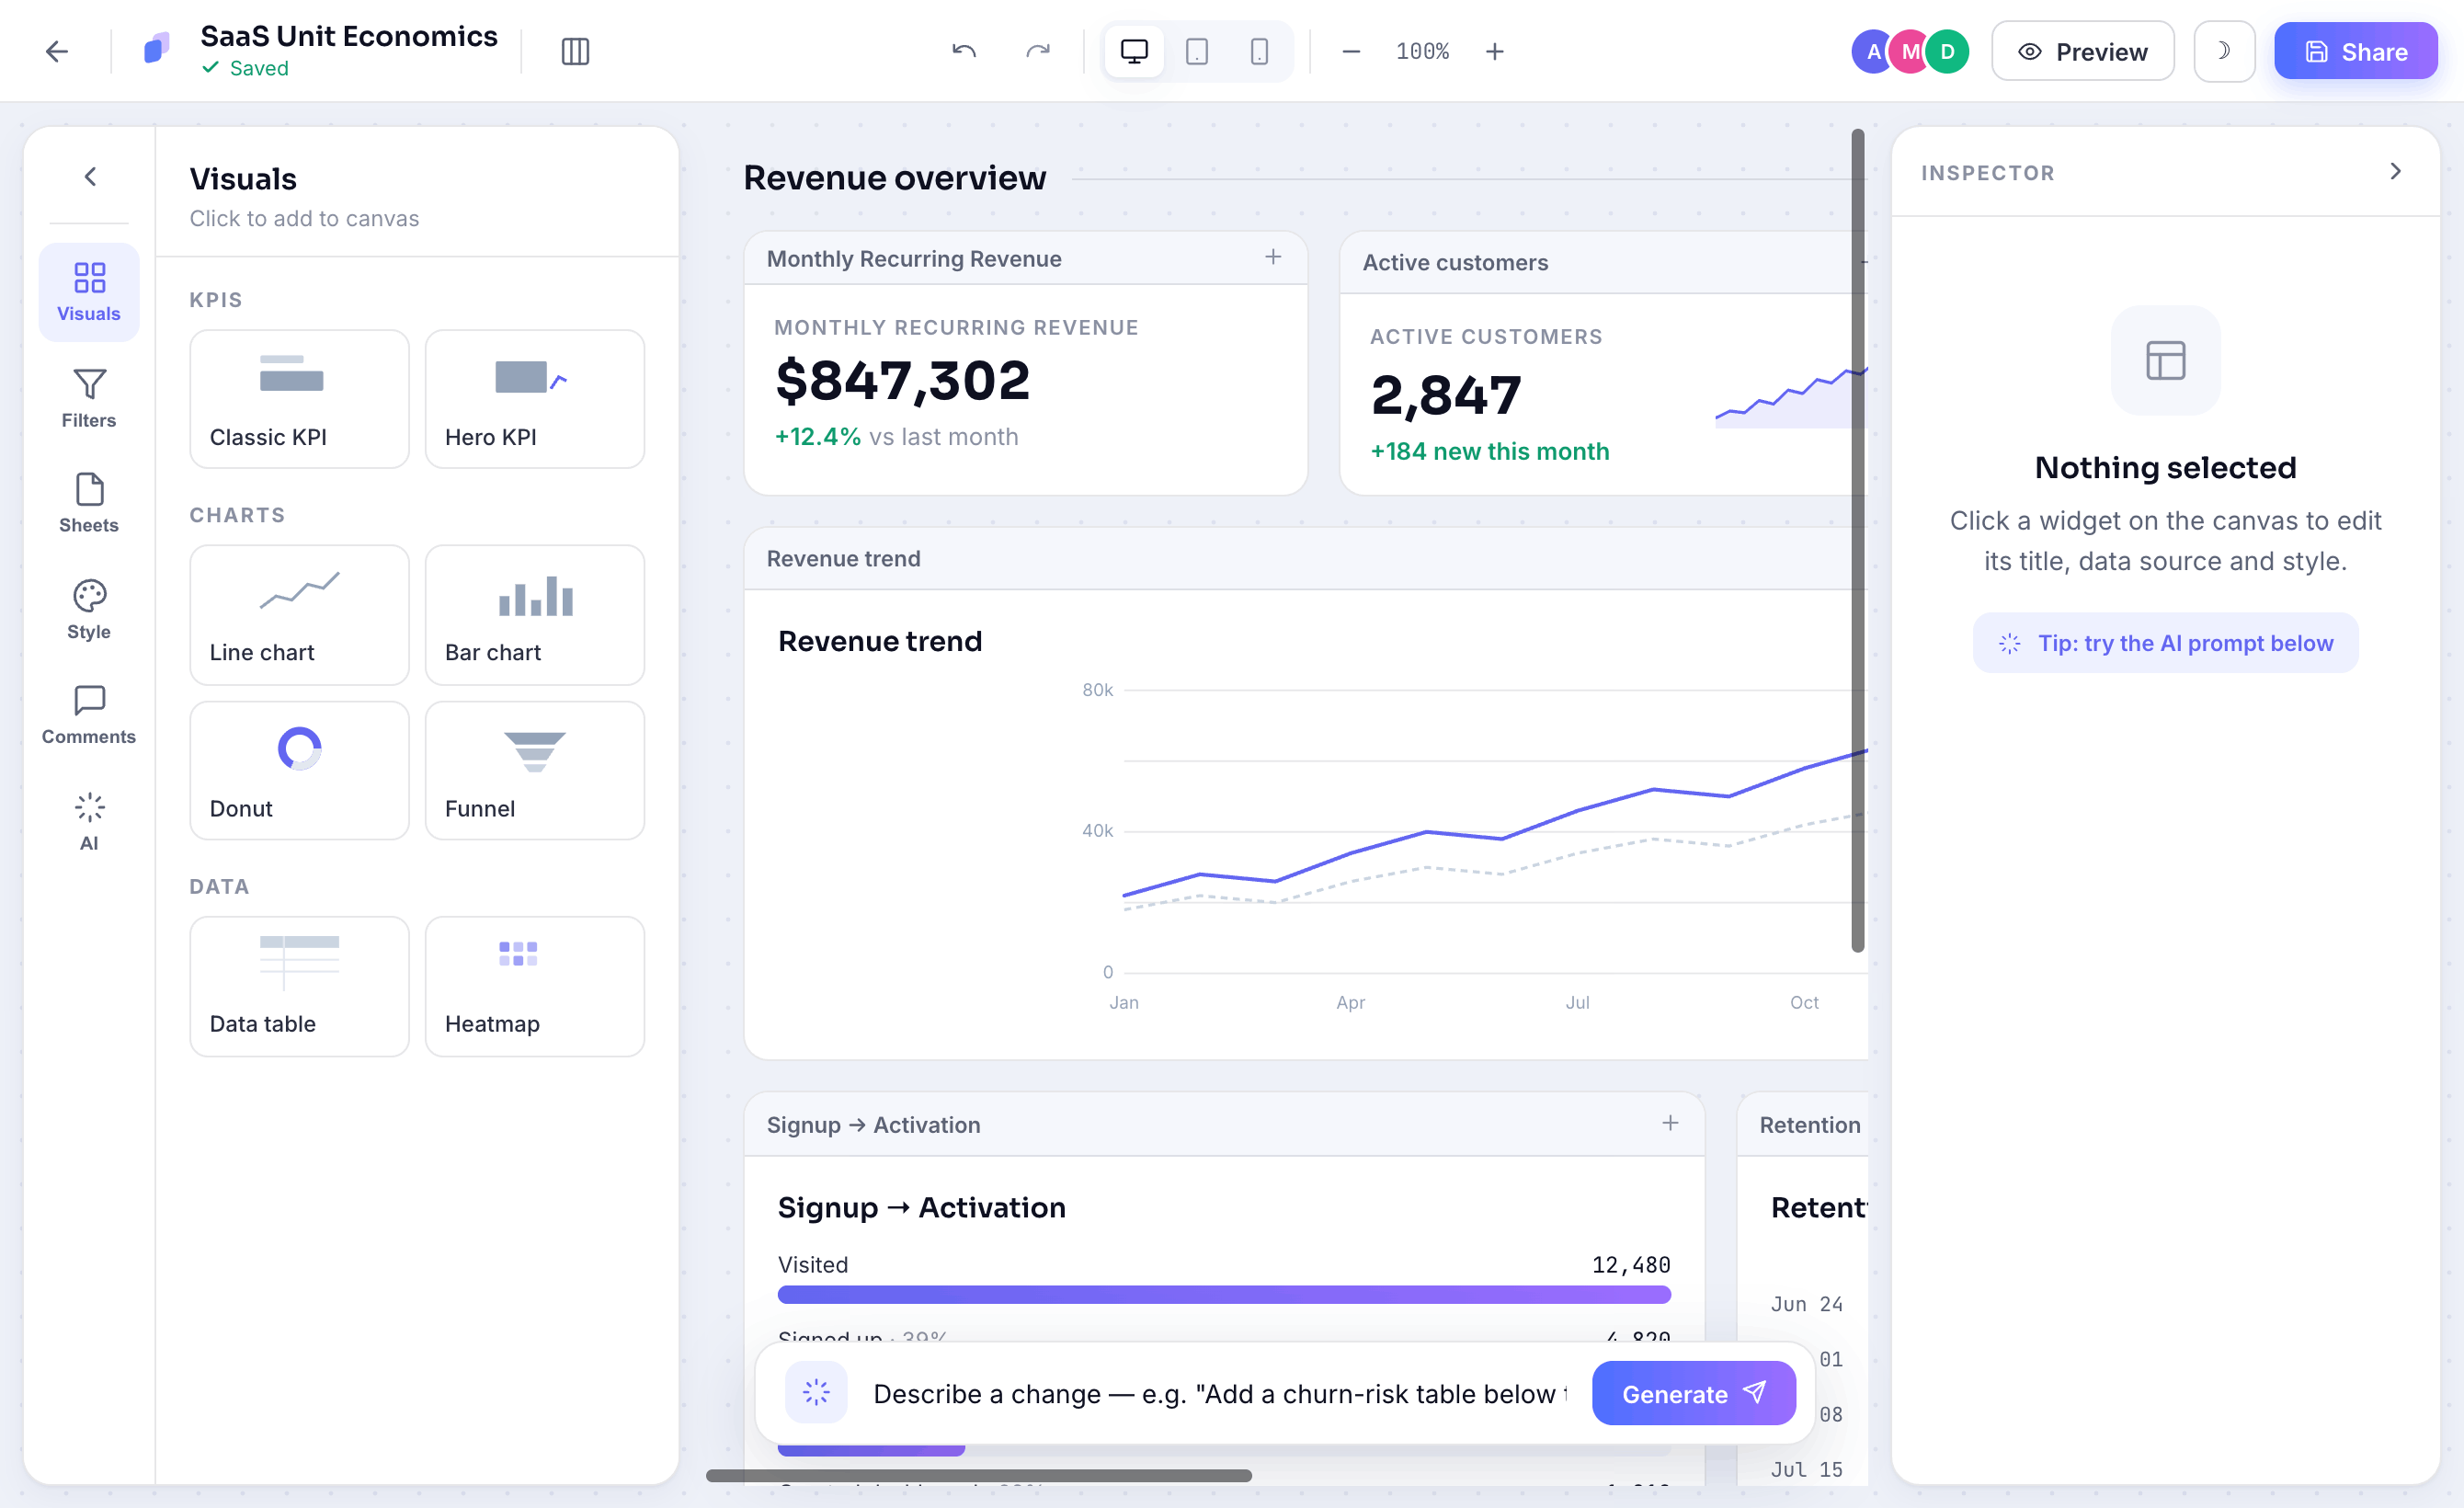
Type the dashboard you have in mind. Previzio lays out the KPIs, charts and filters, picks sensible chart types, and fills it with realistic synthetic data — instantly editable.
- Plain-English prompt → full interactive layout
- Drag, restyle and re-prompt any widget
- Export to Tableau & Power BI when you're ready
Works like Miro. For dashboards.
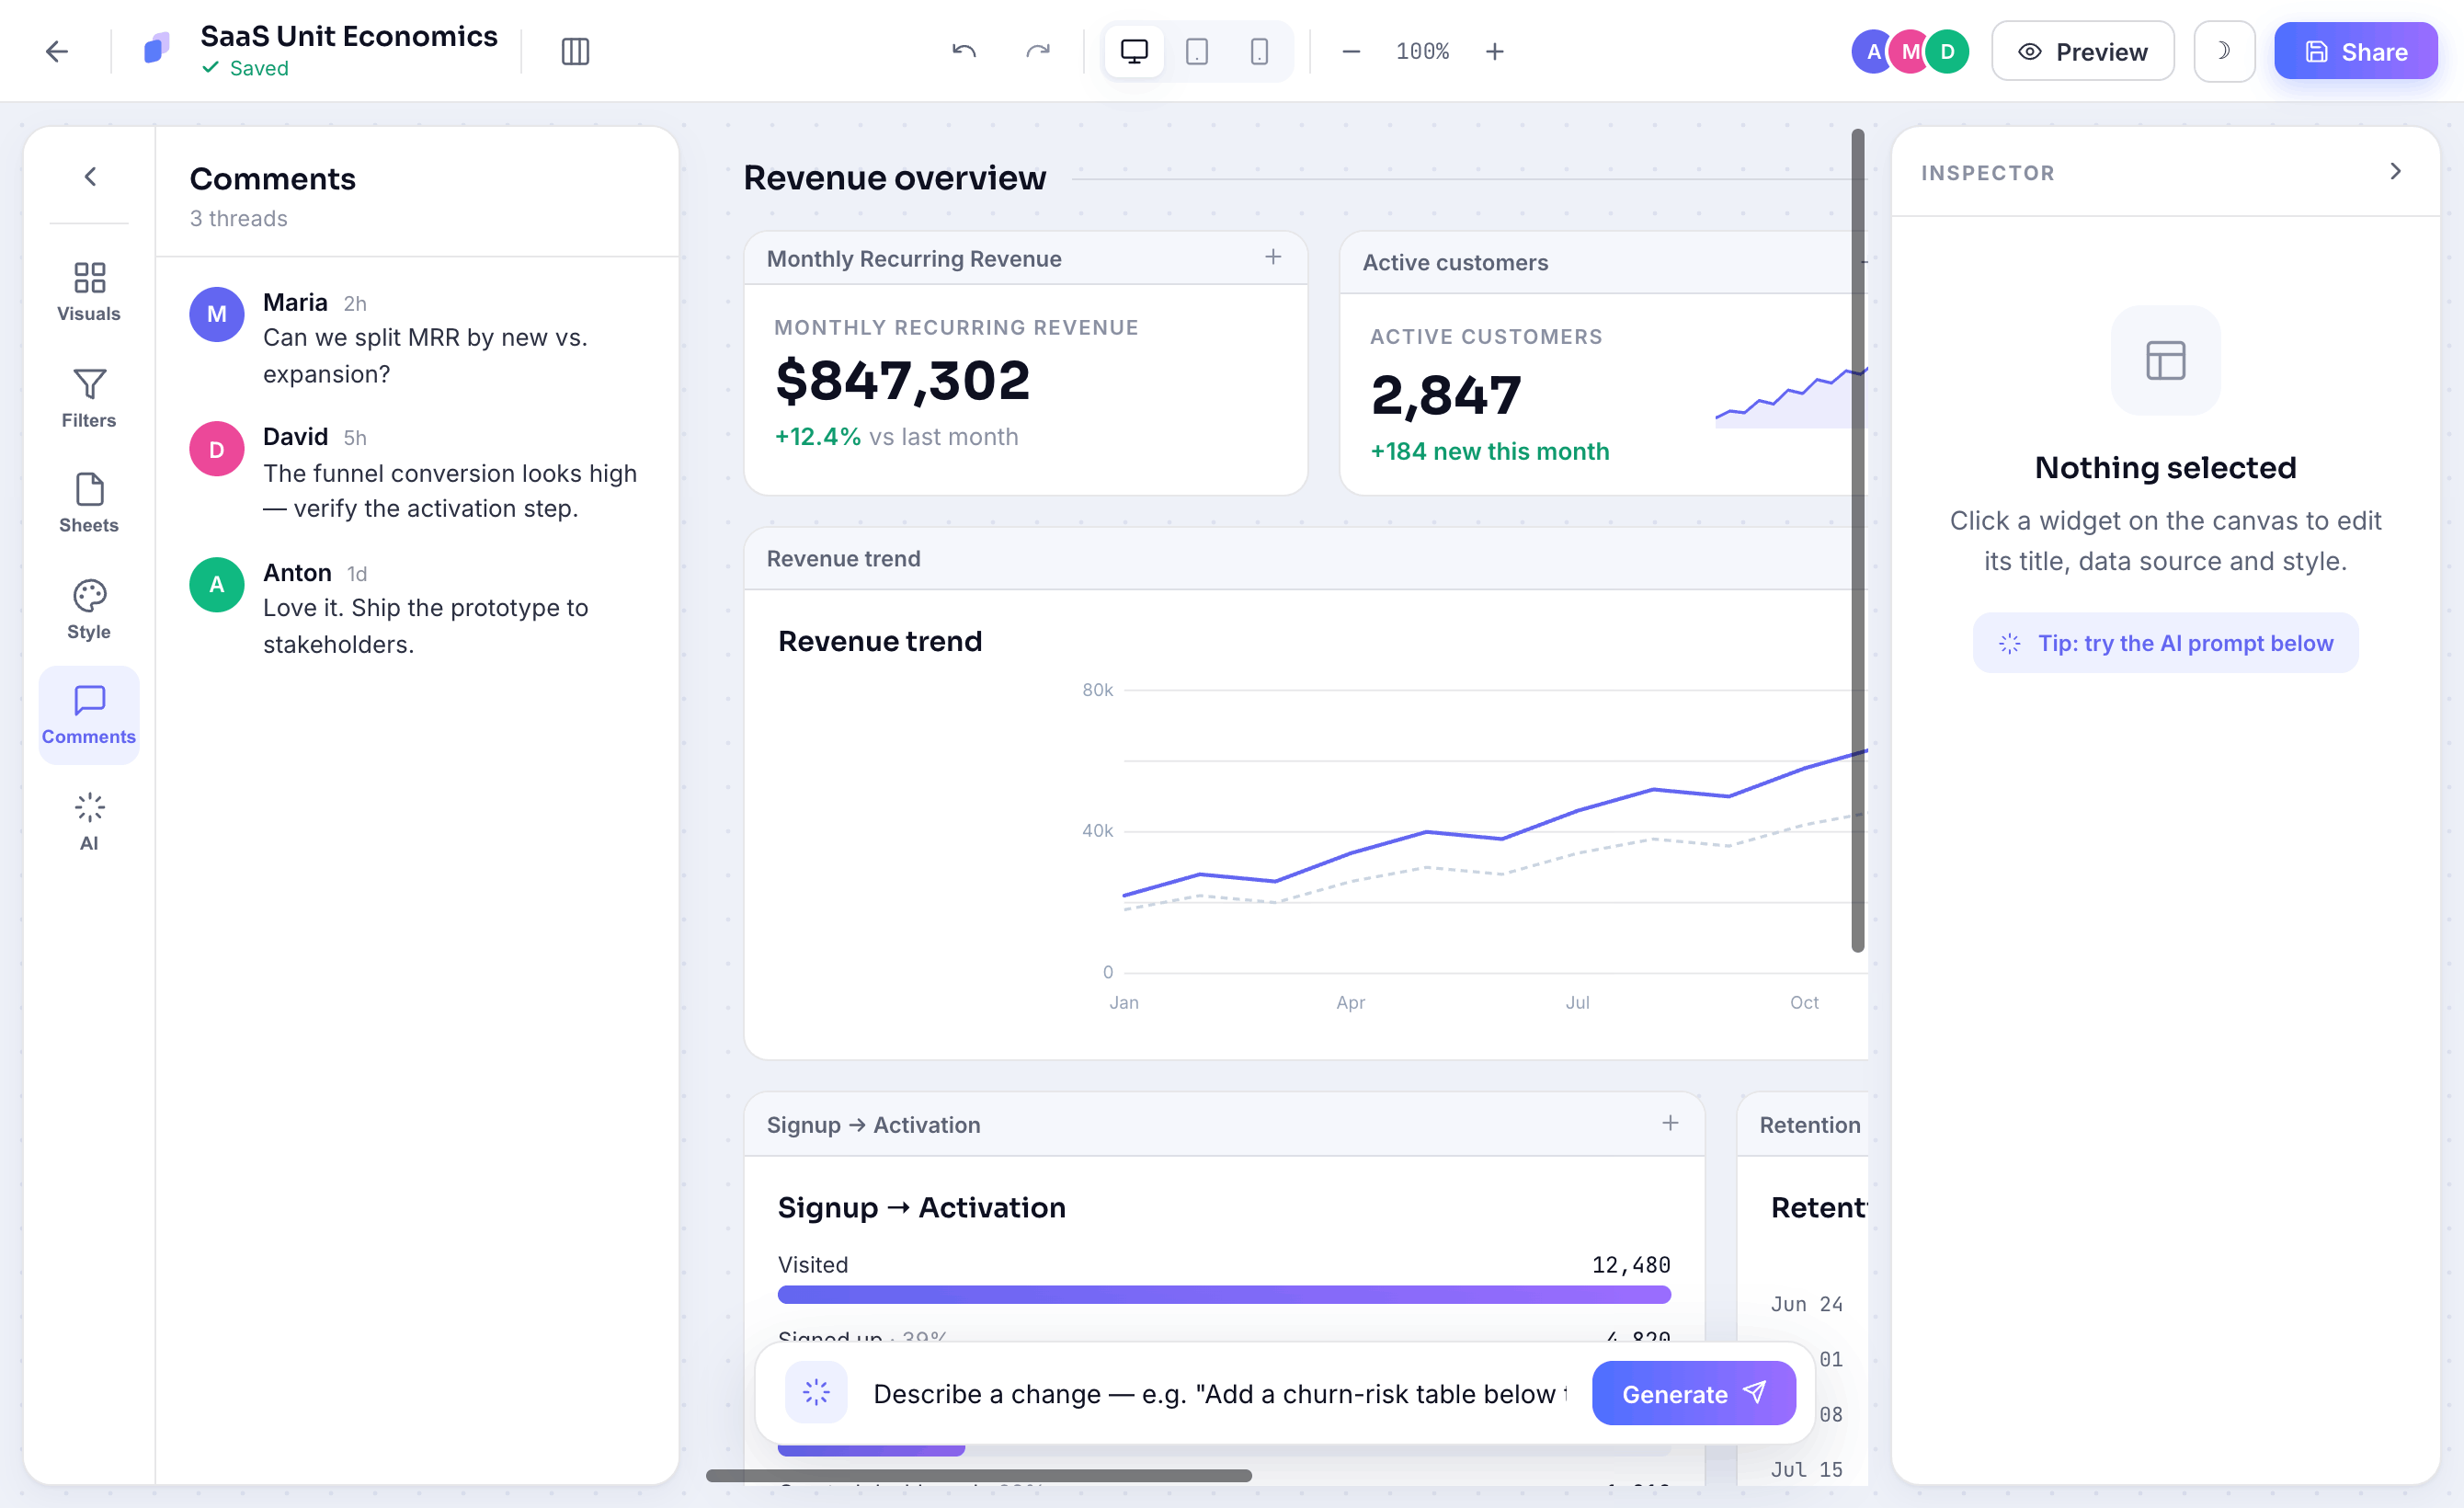
Share a link and iterate together in real time. Comment on a chart, suggest a metric, and watch edits land live — so the whole team agrees on the spec before any data work starts.
- Live multiplayer editing & cursors
- Threaded comments pinned to widgets
- Shareable read-only prototype links
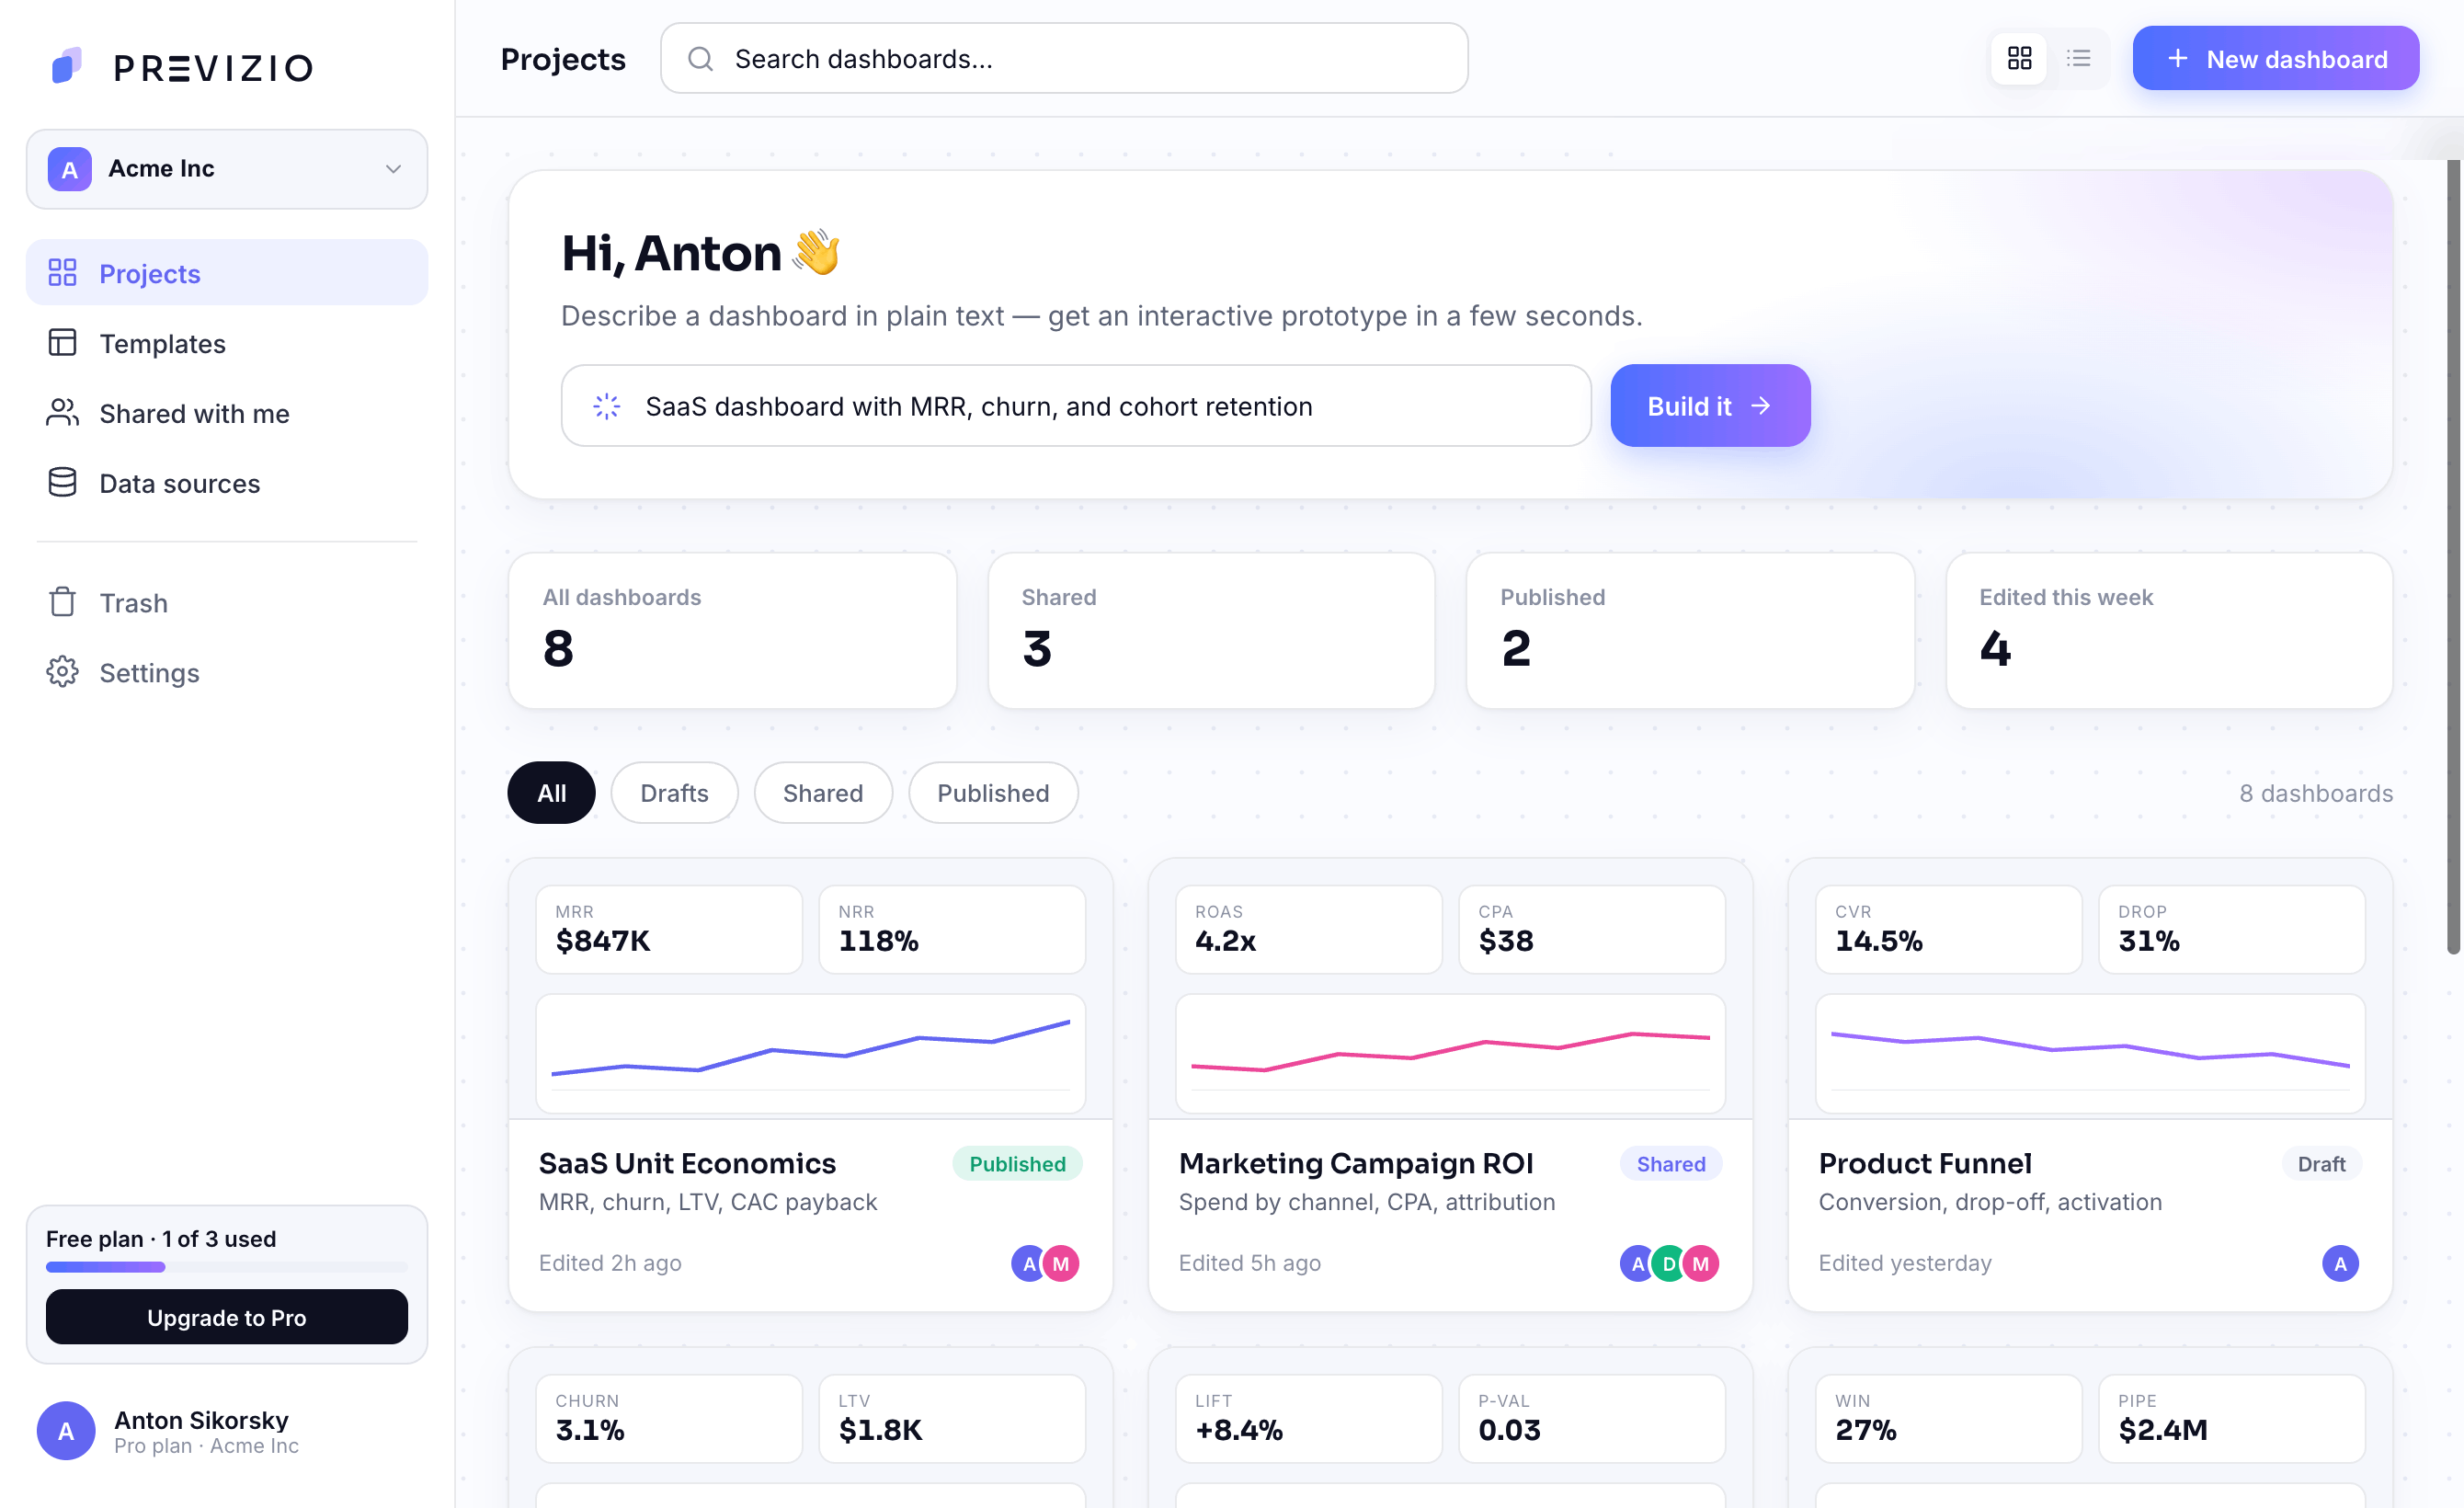
Every prototype, one place.
Drafts, shared boards and published dashboards live in a single workspace. Search, filter by status, and spin up the next one from a prompt — without leaving the page.
Everything a data PM needs — before the data
Text-to-Dashboard
Plain English becomes charts, filters and KPIs. No SQL, no drag-drop.
Unit Economics
LTV, CAC, payback and cohort retention ready to configure.
A/B Testing
Sample size, power and experiment tracking built in.
Bring your own data
Attach a CSV or Excel file, or connect a source — or start instantly on synthetic data.
Style Guides
Auto-generated design tokens keep every dashboard on-brand.
Team Collaboration
Comment, edit and iterate in real time — like Miro.
From idea to prototype in three steps
Previzio inverts the usual order: prototype first, then collect data in exactly the shape the prototype needs.
Describe your vision
Type the dashboard you need in plain text. No wireframes, no tickets, no Figma.
AI builds it instantly
A fully interactive prototype with realistic synthetic data — in about 60 seconds.
Align & collect
Share, comment, iterate. Once everyone agrees, swap synthetic data for real.
Previzio vs the alternatives
Other tools build the final dashboard. Previzio validates the idea first — so you only build what your team actually needs.
| ChatGPT · Gemini · Claude | Previzio | ChatGPT | Gemini | Claude |
|---|---|---|---|---|
Interactive dashboard prototype Filter, drill down and share a live layout | ||||
Realistic synthetic data Seasonal trends, correlations, real distributions | ||||
Drag & drop editor Visual canvas, 25+ widgets, no code | ||||
Export to Tableau / Power BI One-click .twbx, .pbit, .xlsx | ||||
Shareable links & collaboration Send a live link; stakeholders interact | ||||
BI-specific widgets KPI cards, funnels, cohorts, geo maps | ||||
Time to working prototype How fast you get something to show | 60 sec | 4–6 hrs | 4–6 hrs | 4–6 hrs |
Questions, answered
Why prototype first, how we compare, and what it saves you.
They solve different problems at different stages.
Power BI Copilot and Tableau Agent help analysts build final dashboards faster — but only after you've connected data sources, purchased a Premium license (from $50/mo), and know exactly what to build.
Previzio works BEFORE that stage — when you don't have connected data yet and aren't sure what's needed. We help you:
- Validate a dashboard idea in 60 seconds
- Show a prototype to stakeholders and collect feedback
- Avoid 4–8 weeks of rework and $5,000–10,000 in wasted budget
Analogy: Copilot is a production tool for building the final site. Previzio is Figma for validating the design before development.
💡 Example
An agency receives a request for a sales dashboard. Instead of spending 2 weeks on requirements gathering, data connection, and Power BI development — they create a prototype in Previzio in 1 hour, show it to the client, collect feedback, and only then export the approved prototype to Power BI. Savings: 6–10 weeks and $3,000–7,000 per project.
Prototype your next
dashboard in seconds
Start free — describe a dashboard, share it with your team, and find out what you actually need before you build it.